Hello nice people, welcome to The ChArts Reader

Wednesday, October 29, 2025

Volume in Trading

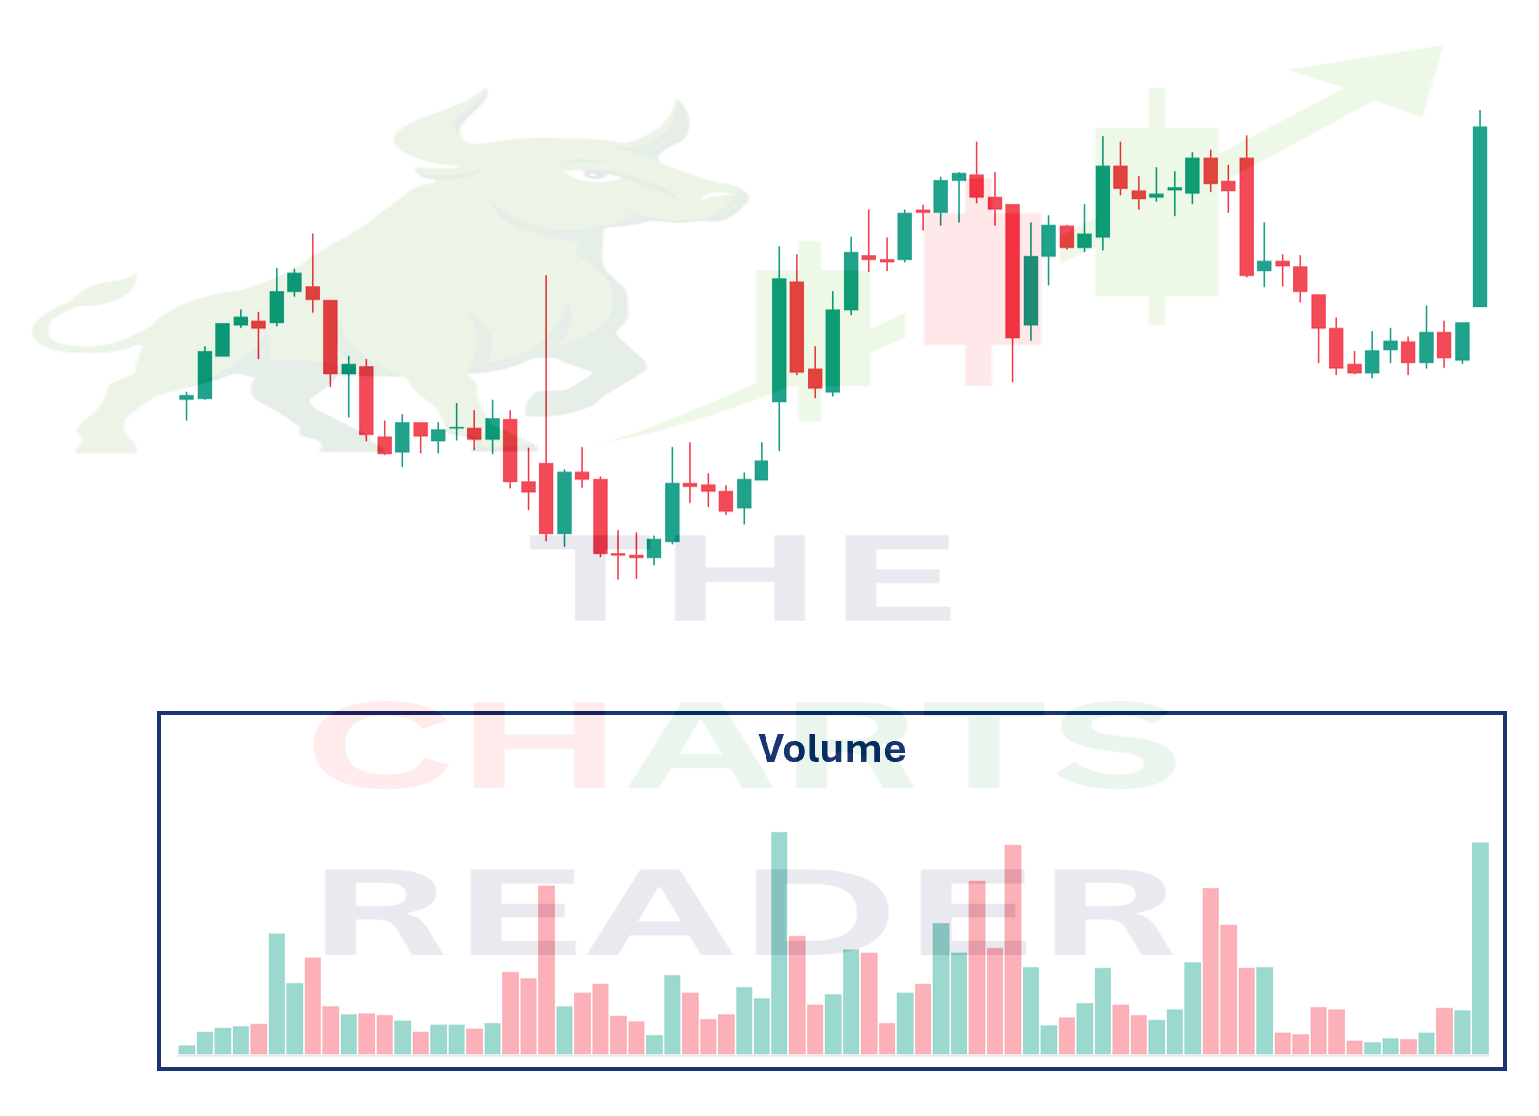
Volume measures the number of stocks traded during a give time period.


Green Bars vs. Red Bars

  • If the price increases from the previous candlestick, the volume bar will be green.
  •  
  • If the price decreases from the previous candlestick, it will be red.
  •  
  • It’s the height and difference in volume bars that are more important!
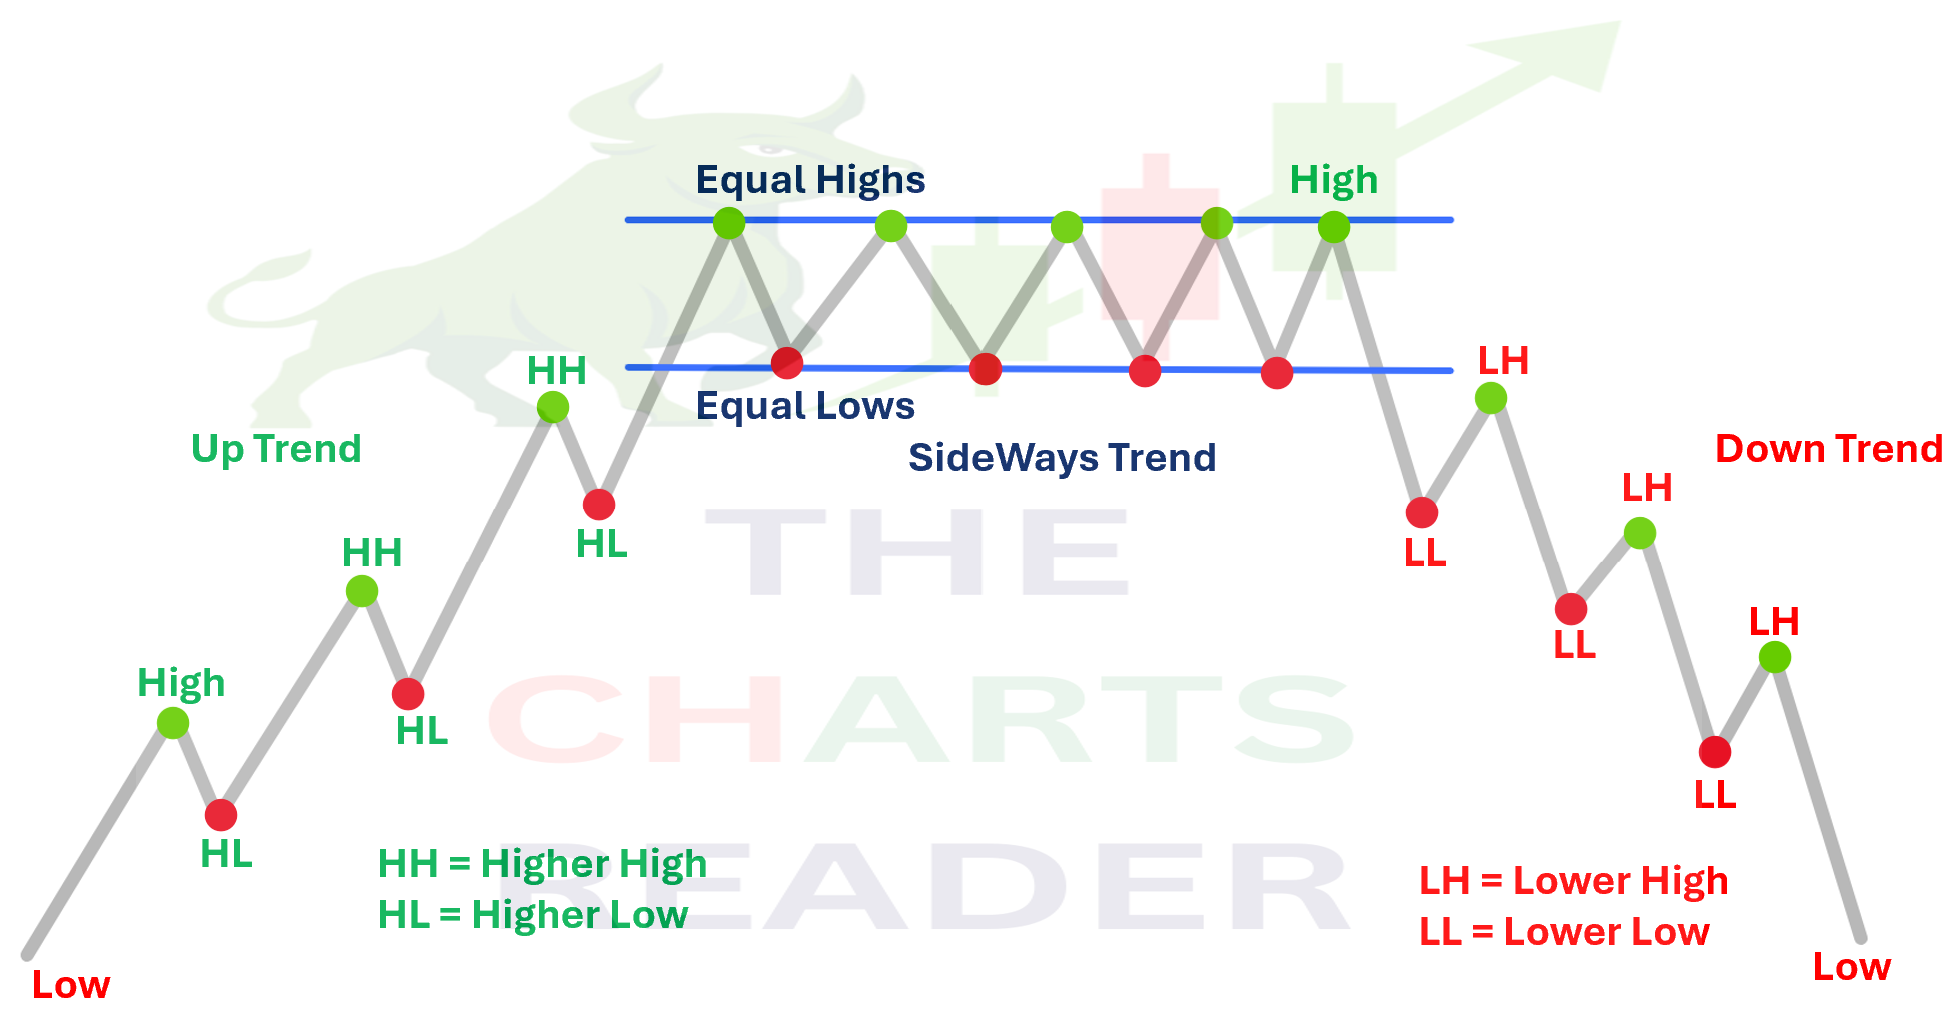
 

Trend...

READ MORE

Monday, October 27, 2025

Trend Trading

In Technical Analysis, a trend is a very important concept.

A market trend refers to the directional movement of prices over time, determined by the sequence of highs (peaks) and lows (troughs) on the chart.


Uptrend — Prices are moving higher, with each successive high and low above the previous ones.


Downtrend — Prices are moving lower, with each succe...

READ MORE

Monday, October 27, 2025

Supply And Demand Trading

The Supply and Demand trading strategy is based on the most fundamental economic concept — that price is determined by the balance between buyers and sellers.

Supply

Supply refers to the amount of an asset available for sale at various price levels.

In trading, a Supply Zone is an area where selling pressure exceeds buying interest, causing prices to fall.


Demand

...

READ MORE

Friday, October 24, 2025

Support And Resistance

Support And Resistance Levels

Support and resistance levels are a core part of technical analysis, providing crucial insight into possible future price reversals. Support and resistance are price barriers — support prevents further fall, and resistance prevents further rise.


What is support ?


Dynamic Support


  • Dynamic support is a ...

READ MORE

Sunday, October 12, 2025

Multiple Candlestick Patterns

"Two Candlestick Pattern" means a pattern that is formed by the combination of two consecutive candlesticks on a chart.
Instead of looking at a single candle, we study the relationship between two candles to understand whether the market might reverse (trend change) or continue in the same direction.


Bullish Engulfing Pattern


Bearish Engulfing Pattern

...

READ MORE

Friday, September 12, 2025

Candlestick Patterns

Types Of Candlestick Patterns:

Depending on the number of candles in the patterns, candlestick patterns can be divided into two types -


Psychology Behind:


Bullish Pattern

  • The price opens at the low and buyers keep pushing the price up throughout the session.
  • It closes at the high, showing no sign of seller strength.
  • This indicates strong bullish senti...

READ MORE

Wednesday, September 10, 2025

The Length Of Candlestick Wick

The Length Of Candlestick Wick


Examples:


Long upper wick (top shadow):


         • Sellers pushed the price down after it went up.


         • Even if the candle is green, it’s often a bearish sign (rejection from higher levels).


Long lower wick (bo...

READ MORE

Wednesday, September 10, 2025

What Is a Candlestick ?

A candlestick pattern is a visual representation of price movements within a specific time frame on a candlestick chart.

1. Opening Price – the price at the starting of the time period.


2. Closing Price – the price at the end of the time period.


3. Highest Price – the maximum price during the period.


4. Lowest Price – the minimum price during the perio...

READ MORE